
Welcome to The I-81 Challenge Website!
The I-81 Challenge planning study has concluded. The New York State Department of Transportation has initiated the environmental review process for the I-81 corridor; current information on the I-81 project can be found at www.dot.ny.gov/i81opportunities.
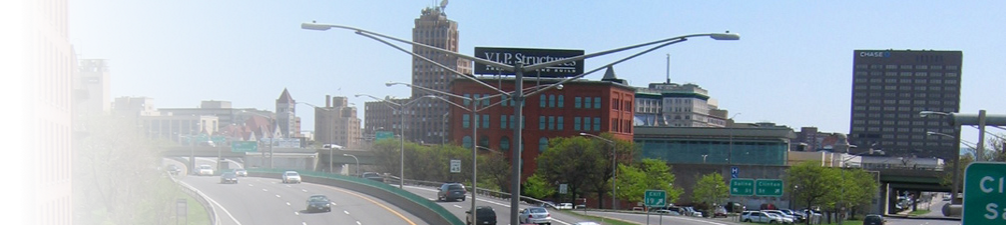
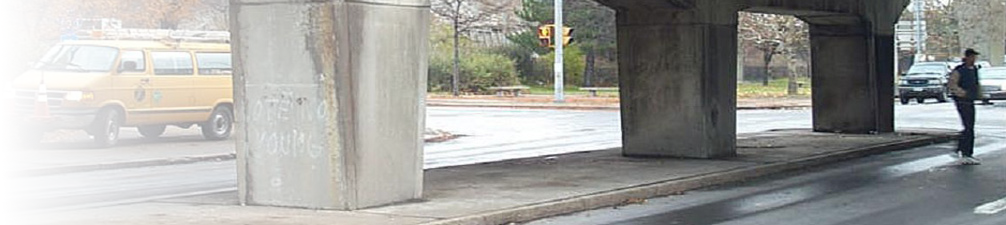
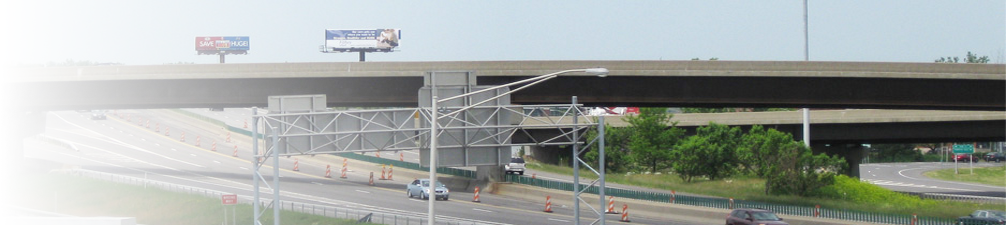
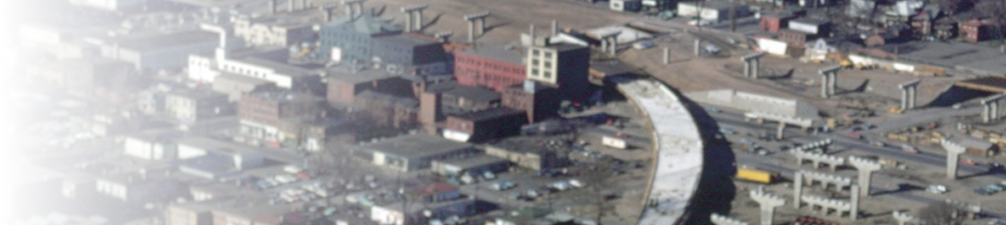
 As you may be aware, portions of I-81 are nearing the end of their lifespan, particularly the elevated sections of the highway in downtown Syracuse. Over the next decade, portions of the road will need to be replaced, reconstructed, removed, or otherwise changed at a significant cost.
Now, the citizens of the Syracuse region have a significant opportunity: a chance to reevaluate the needs and desires of those who use I-81 and live or work in the area, to formulate a vision and a plan that will best serve our goals for the future. Thus, we are posing a challenge; a challenge to you and a challenge to ourselves, a challenge to think big and think outside the box; a challenge to think about the ways that we, both as individuals and as a community, interact with our surroundings and what we need from our transportation systems.
The official decision-making process, The I-81 Challenge, is being led by two entities, the New York State Department of Transportation and the Syracuse Metropolitan Transportation Council (SMTC), the region’s metropolitan planning organization (MPO). Together, these two entities are trying to engage a broad cross-section of community members in developing and evaluating options for the future of this vital corridor.
Get involved. Ask questions. Educate yourself about the process and the facts. The future of the community is in all of our hands.
